
A Rainbow-Maker's Hit List.
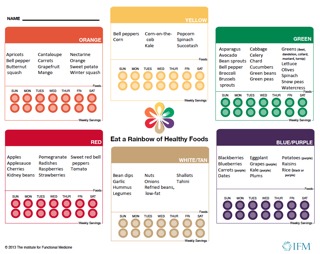
You want to be healthy, of course you do, but let’s face it, it can be pretty tough to keep track of the fruits and vegetables you and your family eat every day. How many servings should you be consuming anyway, and don’t the recommendations increase every year? And which plant foods are best? (It's a big topic. More than thirty thousand scientific studies have been published on phytonutrients since the year 2000!) Thankfully, there are tools for keeping track of this. My favorite is the Rainbow Chart from the Institute for Functional Medicine. This tool makes it easy and fun for anyone, even kids, to make sure they are getting 8-12 servings of fruits and vegetables every day, across the entire phytonutrient spectrum.
So let’s take a look at it. The first chart shown here is a simplified version for kids. I really like this one and use it myself. I guess the kid in me still likes to check things off.
The second chart below is more complete. I use it whenever I’m wondering what else I could eat to meet my goals for the day.
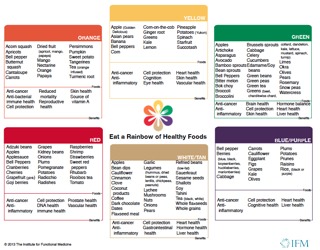
I also use this chart simply as a diagnostic tool, a snapshot of where a particular patient might stand with their phytonutrient intake. Or for myself, I just glance at the chart and mentally circle all the foods I've eaten in the last 24 hours. I'm often surprised by how few of these foods I can circle and how they cluster around only one or two colors. We tend to eat not only the same foods over and over again, but the same kind of foods. This can leave some big holes in our phytonutrient spectrum, like holes in the ozone layer, or holes in a suit of armor. Not good.
Counting Is Dead; Long Live Counting.
Here's one fun fact that generally gets a hearing: did you know that obesity is associated with a relative lack of nutrients? Most of us think of obesity as a state of over-nutrition. But researchers have found that it may turn out to be a state of undernutrition. You may even have heard the phrase "overfed and undernourished" making its way into public discussion. A recent study in the Journal of Human Nutrition and Dietetics found that, calorie for calorie, obese individuals consume significantly fewer phytonutrients than non-obese individuals, as measured by dietary phytonutrient-index:
- Phytochemical Calories/Total Calories x 100
The same researchers also noted that phytonutrient intake was inversely proportional to inflammatory markers in the blood stream (CRP, IL-6, IL-1, and lipid peroxidase debris).
In other words, not only were folks with a low phytonutrient-index fatter, they were more inflamed! Inflammation by itself, is an independent risk factor for numerous diseases, most spectacularly heart disease. What the researchers did not explain was whether the inflammation caused the fat or the fat caused the inflammation. Either way, it appears to be linked to undernutrition: not enough phytonutrients.
Maybe it's time to officially start counting colors instead of calories. What do you think?
Reference:
- Vincent et al. J Hum Nutr Diet. 2010 Feb;23(1):20‐9. Epub 2009 Sep.
For Your Eyes Only.
And so now we come to it, the part where the rubber meets the road, the part where we go from knowledge to action. How do you make phytonutrients a part of your daily life? Ask yourself what this might look like at your home. Below is an example of a really good week of phytonutrient power at the Wagner house:
As you can see, we attached clear plastic covers to the charts so we could reuse them with dry erase markers. Pretty handy. Have fun with it. Create some friendly competition. Our kids have superfood fights now! Miracles do happen.
Some of the Best Things in Life Are Indeed Free.
You don't always need an inquisition's worth of medical treatment or a costly fitness program to improve your health. Information is free and what you do with it can be liberating.
So I feel like I want to give something away today. Totally FREE.
The Institute for Functional Medicine (IFM) has an all-new color chart for kids. It's even better than the one I just showed you. And the institute actually gave me permission to give a few copies away!
Plus two more things: a full-color, 32-page e-book called: The Phytonutrient Spectrum Comprehensive Guide. And a Companion Poster, which I would recommend posting on your fridge.
I can almost hear the tumblers clicking in your head: This is just common sense. Eat more fruits and veggies! Duh.
True. But common sense isn't common action, or we'd all be doing it already. Even doctors need a little help translating their knowledge into action--that's why 44% of them are overweight.
Click on the download below to receive these 3 FREE Tools to Help You:
Get a Free Rainbow Chart From IFM
Don't wait. Get colorful right away. When it's fresh in your mind, it will be fresh on your plate.
Yours in Health and Resilience,
Marc Wagner, MD, MPH
Related Posts: